Turn Your Business Data Into Actionable Decisions
Custom dashboards for your business. Understand your revenue, customers and operations in minutes.
Common Problems
Solutions
No clear view of daily customer distribution & best-selling items
Hard to track repeat customers & promotions impact
Inventory stock-outs or excess stock
Manual Excel work every week/month
Live dashboards: customer distribution, AOV, top products/services
Customer insights & repeat rate tracking
Inventory alerts & demand forecasting
Automated refresh from POS/Excel/CSV
Why is Data Analytics the Key to Your Business Success?
Your business data is more complex than you might expect.
More powerful than you might realize.
With far greater potential than you may have imagined.
It can help you cut costs, identify growth opportunities, and boost customer satisfaction.
Restaurant Data Structure:
Examples of Data Analytics:
• Table Turnover Rate
• Average Order Value
• Customer Repeat Rate
• Reservation No-Show Rate
• Menu Item Popularity
• Customer Satisfaction Score
• ...
Manufacturer Data Structure:
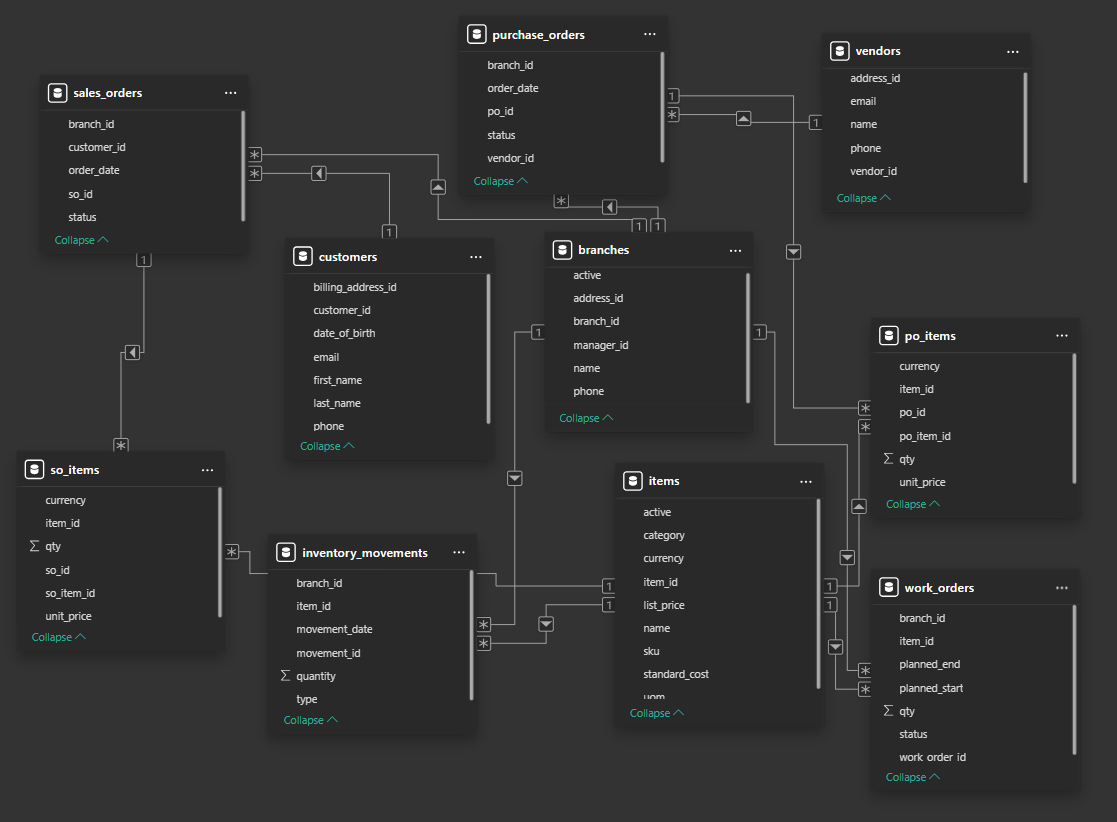
Examples of Data Analytics:
• Production Yield
• Machine Utilization Rate
• Inventory Turnover Rate
• Defect Rate
• Supplier On-Time Delivery Rate
• Energy Consumption per Unit Produced
• ...
Health Care Data Structure:
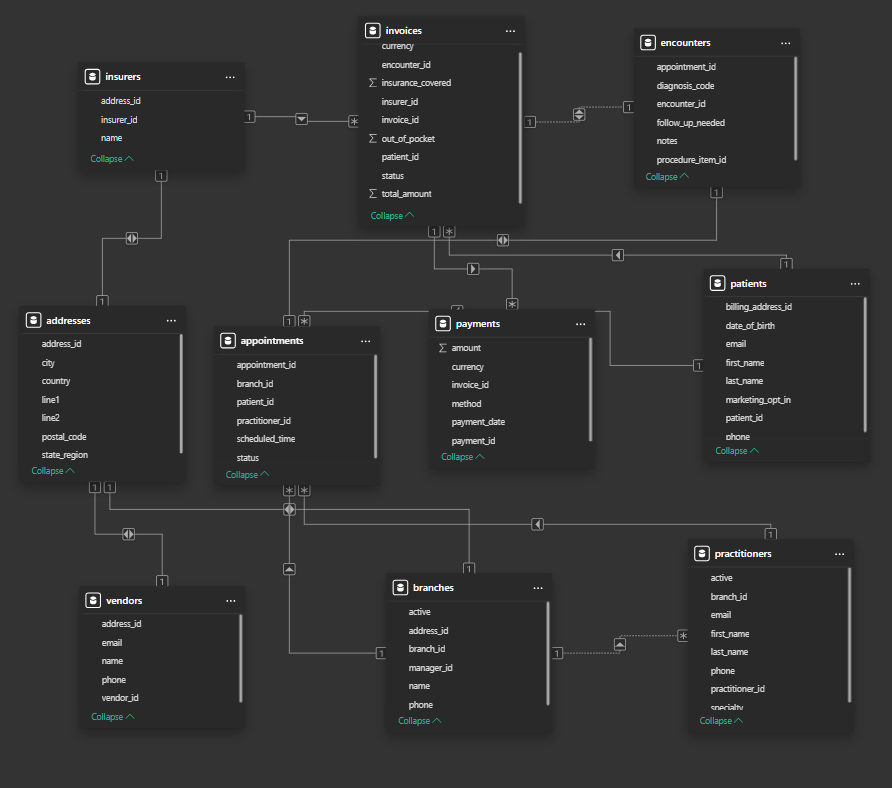
Examples of Data Analytics:
• Patient Wait Time
• Appointment No-Show Rate
• Bed Occupancy Rate
• Average Consultation Duration
• Doctor-to-Patient Ratio
• Insurance Claim Processing Time
• ...
Hotel Data Structure:

Examples of Data Analytics:
• Occupancy Rate
• Revenue per Available Room
• Guest Repeat Rate
• Average Length of Stay
• Gym / Pool Usage Rate
• Complaint Resolution Time
• ...
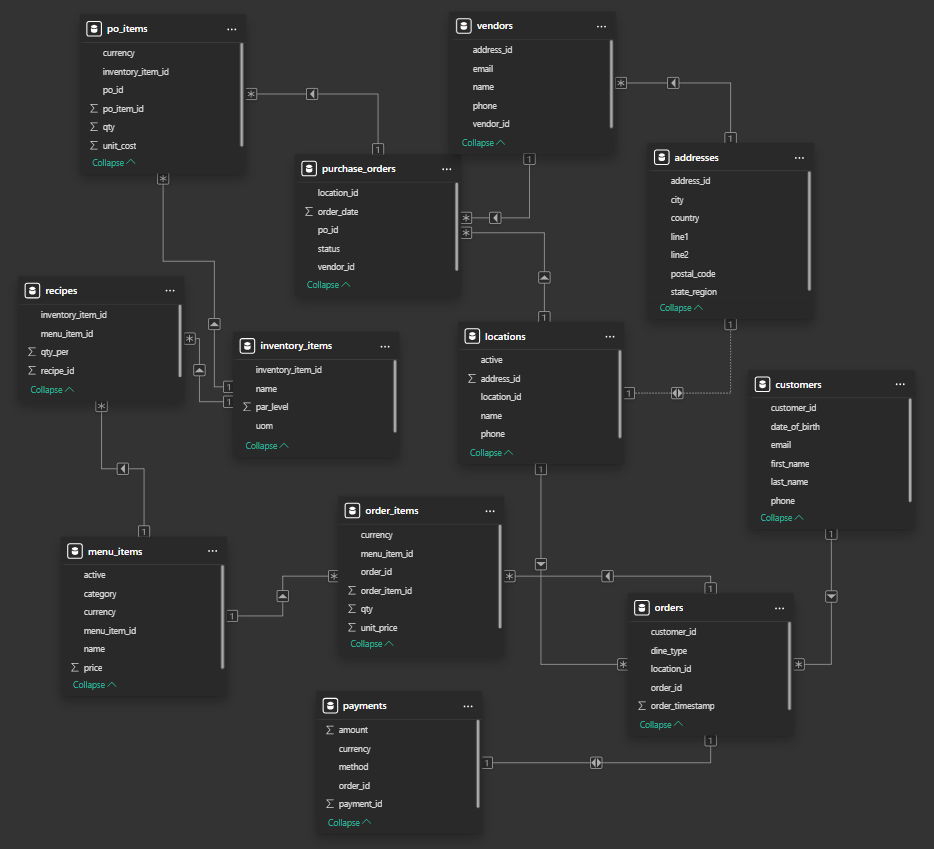
Food Retailer Data Structure:

Examples of Data Analytics:
• Purchase Orders
• Cost Layers
• New / Repeat Customers
• Daily Sales
• Stock-Out Frequency
• Ingredient Consumptions
• Waste Percentage
• ...
Car Rental Data Structure:
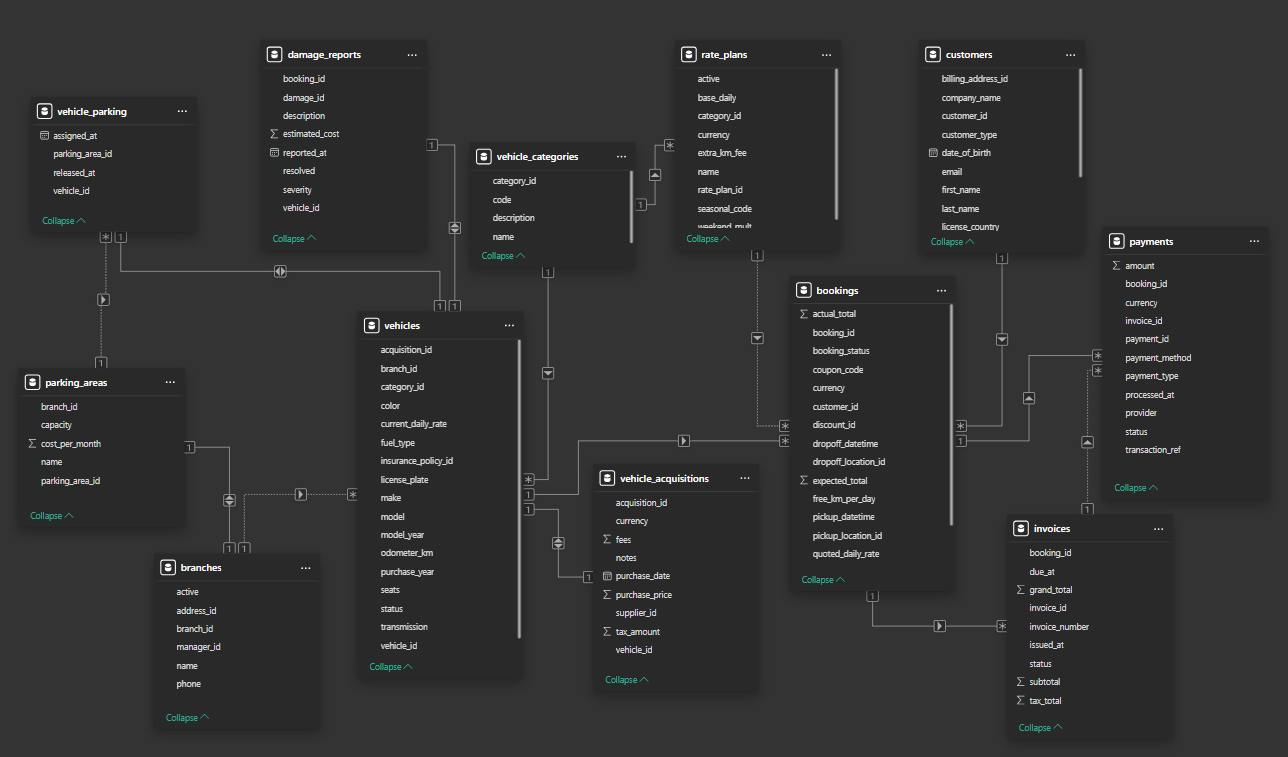
Examples of Data Analytics:
• Average Rental Duration
• Vehicle Availability Management
• Booking Success Rates
• New / Repeat Customers
• Vehicle Maintenance Costs
• Insurance & Claims
• Carpark Space Cost
• ...
Data analysis helps you to cut cost, to identify growth opportunities, and boost customer satisfaction.
Unlock the Full Potential of your data today.
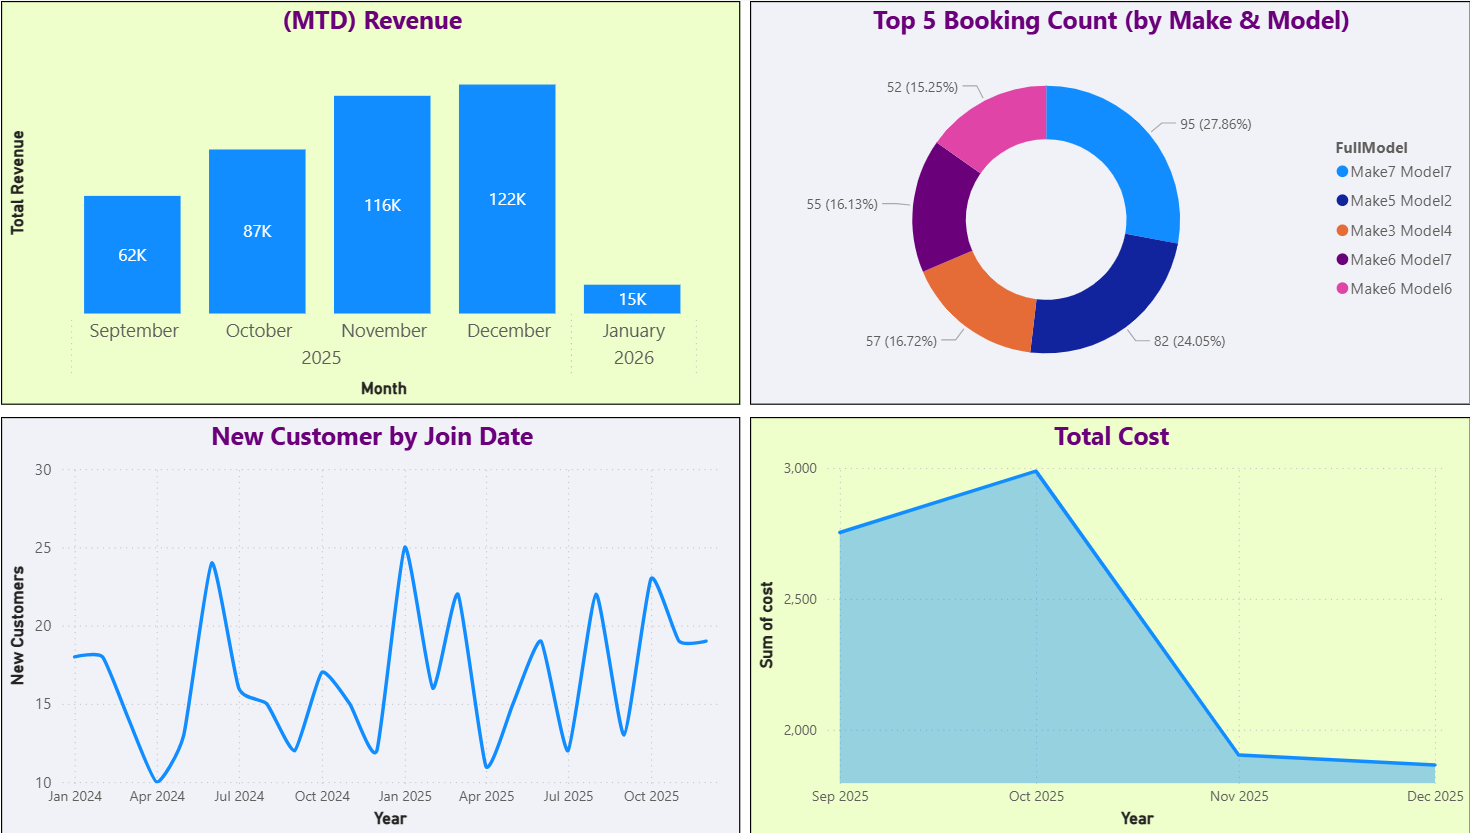
Example Dashboards (Mobile)
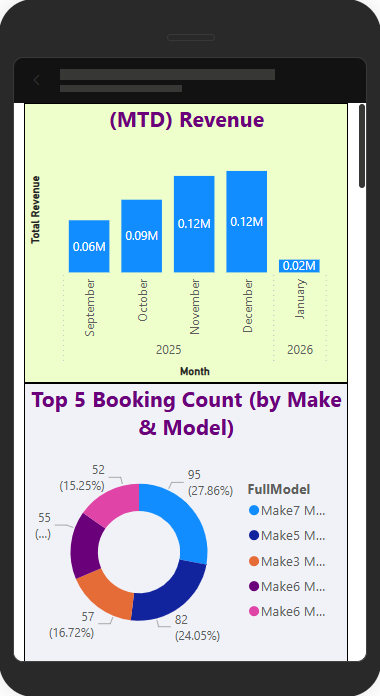

Stop guessing. Start measuring. Make smarter decisions everyday.
Sales Analytics
Daily/weekly revenue, AOV, top SKUs, channel split.
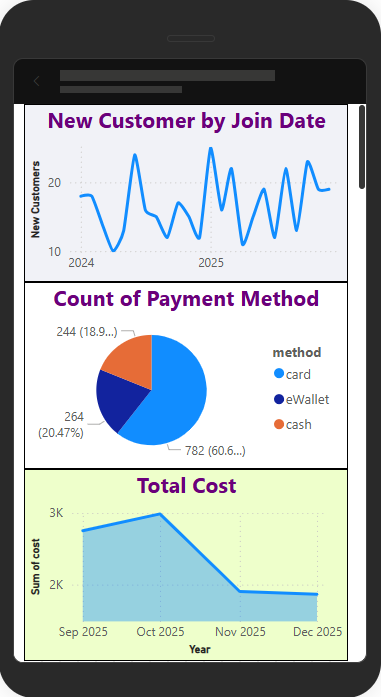
Customer Insights
New vs returning, repeat rate, cohort views and LTV.
Inventory / Operations
Stock coverage, demand forecasts, utilization rates.
How It Works
1) Share Your Data Structure
Excel / CSV / JSON / SQL. No complicated setup.
2) We Build Your Dashboard
Custom KPIs and visuals tailored to your business.
3) Decide with Confidence
Daily/Weekly/monthly refresh & optional advisory support.
Frequently Asked Questions
Through Data analytics you get insights that help you make faster and better decisions.
Even simple information — like daily sales, product lists, or inventory — is enough to begin.
We help you structure your data properly and build dashboards that grow with your business.
If your website stores customer or transaction data, we can connect a dashboard directly to the database so your insights update automatically.
If not, we can still build analytics using exported data.
1–2 weeks for a simple dashboard 3–4 weeks for a full sales + cost + inventory system
Time varies depending on data complexity and your requirements.